Healthcare Analytics Portfolio

Showcasing our precision data analysis and advanced modeling for medical and health insights across Africa.

Featured Work

Driving Decisions in Healthcare

From clinical trials to epidemiological tracking, discover how our data solutions impact the healthcare sector.

Epidemiology Model Dashboard

Longitudinal Malaria Mortality Analysis (1990–2016)

The Problem

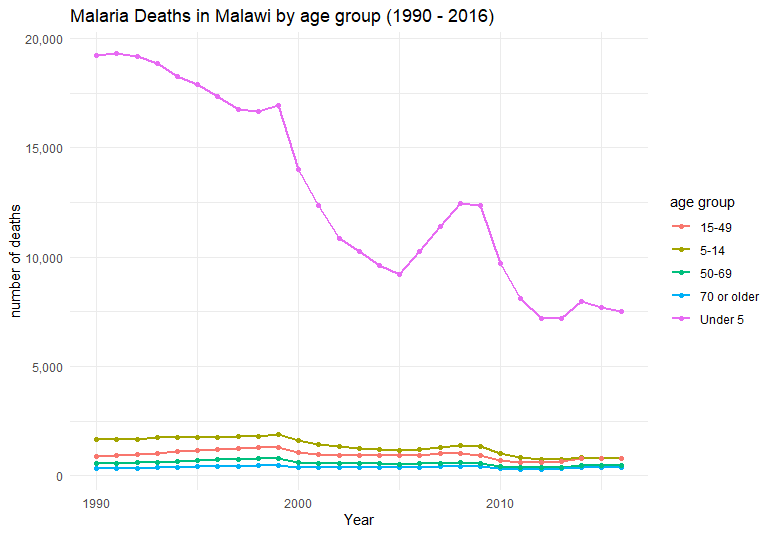
Malaria surveillance in Malawi required a more granular understanding of age-specific mortality. Standard visualizations often overshadowed trends in older populations due to the massive volume of childhood deaths, making it difficult to assess the efficacy of interventions across all age groups.

Methodology & Integrity

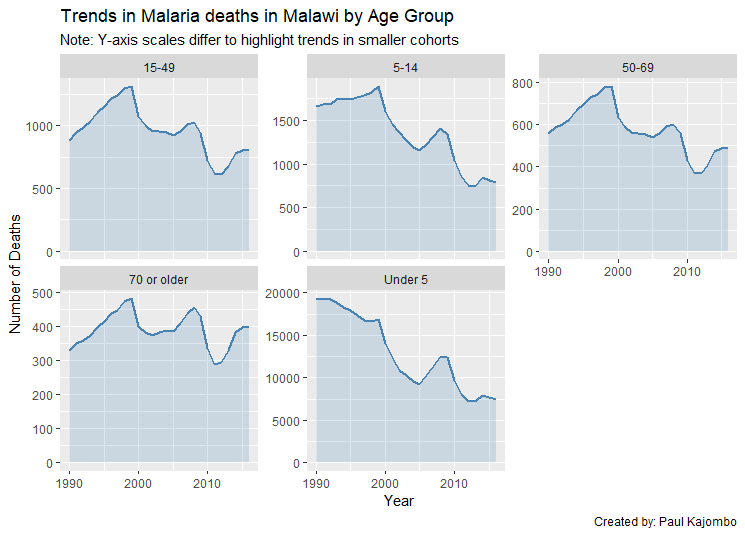
Utilizing a 26-year longitudinal dataset, we implemented data faceting with independent Y-axes. This statistical approach ensures that the mortality trajectories of smaller cohorts (e.g., age 70+) are visually accessible and not mathematically "silenced" by the Under-5 demographic.

Key Insights (The "So What?")

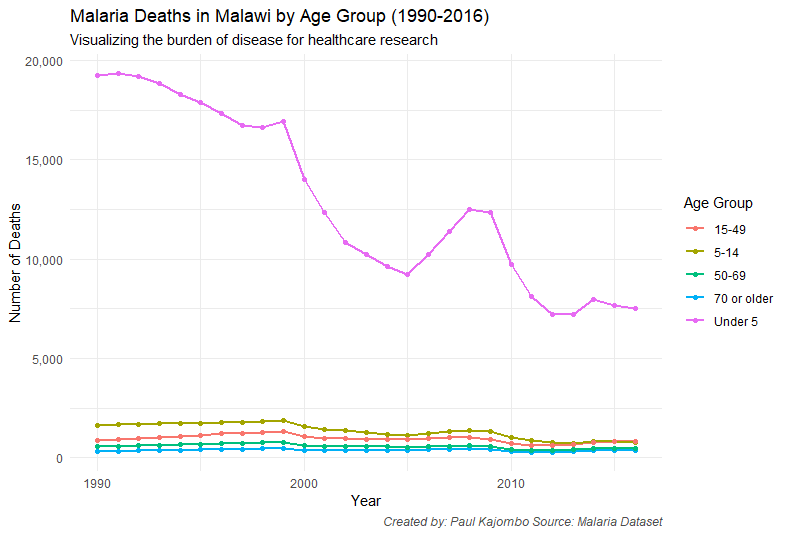
  • Dramatic Reduction: Visualized a major decline in Under-5 deaths from nearly 20,000 in 1990 to under 8,000 by 2016.
  • Synchronized Spikes: Identified parallel mortality surges in 2008–2010 across all age demographics, suggesting systemic environmental or reporting drivers.

Tech Stack

R (Shiny, ggplot2) Advanced Excel

Analysis Visualizations

Clinical Data Visuals

Patient Flow and Physical Health Marker Analysis

The Problem

Clinical administrators lacked a clear view of how seasonal admission volatility intersected with patient demographics. Without this, it was difficult to predict resource needs or understand if physical markers like BMI were being influenced by the aging population within the facility.

Methodology & Integrity

We engineered a longitudinal tracking system for monthly admissions and applied linear regression to biometric data. By utilizing 95% confidence intervals and rigorous data cleaning, we ensured that the relationship between age and health markers was statistically sound and free from entry errors.

Key Insights (The "So What?")

  • Admission Peaks: Identified a significant surge in patient volume during August (13 admissions), contrasting with a low of 5 in April.
  • Myth-Busting Correlations: Proved that age is not a strong predictor of BMI in this cohort, as shown by the flat regression line and high variance across all ages.
  • Operational Readiness: Enabled the facility to anticipate a 160% increase in capacity needs between the first and third quarters of the year.

Tech Stack

R (tidyverse, ggplot2) Python (Pandas)

Analysis Visualizations

Hospital Operations Dashboard

Clinical Outcomes and Discharge Pathways

The Problem

A healthcare provider faced bottlenecks in patient discharge, with uncertainty regarding whether "Length of Stay" (LOS) was being driven by patient age or the efficiency of the next-step care facility (Rehab vs. Home).

Methodology & Integrity

We developed a correlation matrix to isolate variables affecting hospital stay duration. Using categorical boxplots, we mapped the distribution of stay lengths against discharge outcomes, maintaining high data integrity by identifying and isolating outliers that would otherwise skew the median results.

Key Insights

  • Discharge Bottlenecks: Discovered that patients transferred to "Another Facility" have a higher median stay (9 days) compared to those sent home, indicating external coordination delays.
  • Statistical Independence: Confirmed a weak negative correlation (-0.14) between age and hospital days, shifting the focus from "age-based care" to "condition-based care."
  • Outlier Visibility: Pinpointed specific rehabilitation cases exceeding 20 days, allowing for a targeted audit of complex recovery protocols.

Tech Stack

Advanced Excel Python(pandas, seaborn)

Analysis Visualizations

Public Health Policy Analysis

Biometric Surveillance and Activity Baselines

The Problem

Establishing "normal" cardiovascular baselines in a patient population is difficult due to the high volume of noisy data from wearable devices. The goal was to determine if daily physical activity (steps) had a linear relationship with heart rate variance.

Methodology & Integrity

To process thousands of data points without losing detail, I utilized hexagonal binning to visualize data density. I applied Loess smoothing to the trend lines to filter out incidental heart rate spikes, ensuring the final analysis reflected sustained physiological states rather than data noise.

Key Insights (The "So What?")

  • Density Discovery: Mapped the highest concentration of patient activity at low step counts with resting heart rates (~75 BPM), defining the "typical" patient profile.
  • Cardiovascular Efficiency: Observed a remarkably stable median heart rate across all activity quartiles, suggesting the cohort maintains cardiovascular stability even as step counts increase.
  • Anomaly Detection: Successfully isolated extreme outliers exceeding 200 BPM for further clinical investigation into potential tachycardic events.

Tech Stack

R (ggplot2, hexbin) Biometric Data Processing Loess Smoothing

Analysis Visualizations

Ready to unlock insights in your health data?

Partner with Afrisyntax for rigorous analysis and actionable intelligence.

Get a Custom Quote